Risk Based Process Safety: A Complete Guide for Industry

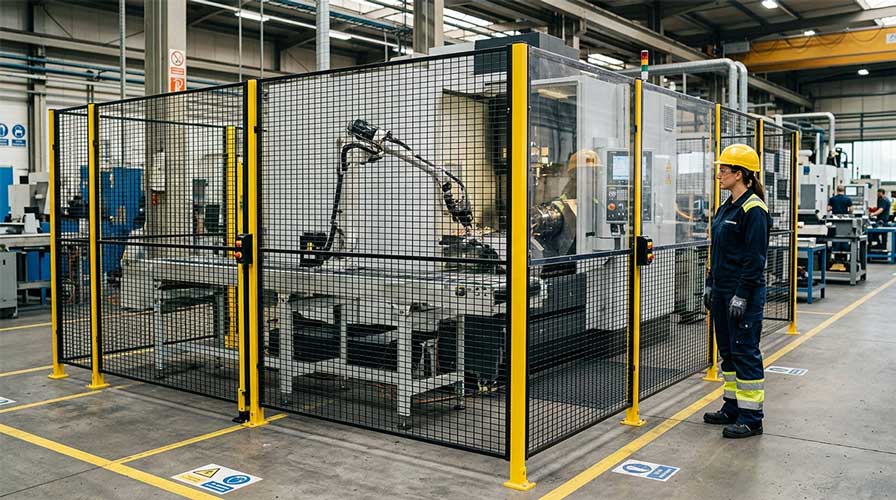
Risk Based Process Safety decides whether a plant runs for decades without incident or ends up in a Chemical Safety Board report. Most facilities already track hazards on paper but paper does not stop a process safety incident from happening on a day when three small failures line up at once. That is why RBPS exists. It forces organizations to rank hazards by actual consequence and likelihood, then spend time and budget where the risk is highest, instead of spreading effort evenly across every procedure regardless of severity. A strong safety culture makes this work in practice, because engineers can build the best risk matrix in the world, but it means nothing if operators do not report near misses or if management ignores warning signs. This guide breaks down what Risk Based Process Safety actually requires, from hazard identification to emergency preparedness, so your team can apply it, not just file it away.

What Is Risk Based Process Safety? Definition and Scope

Risk Based Process Safety is a management framework that helps organizations decide where to focus safety resources based on actual consequence and likelihood, rather than applying the same level of scrutiny to every hazard in a facility. It was developed by the Center for Chemical Process Safety, commonly known as CCPS, and it now shapes how refineries, chemical plants, and offshore platforms structure their process safety management programs. RBPS does not replace regulatory compliance. Instead, it builds on top of it, because a facility can meet every OSHA requirement on paper and still miss the specific hazard that causes an incident. The scope of RBPS covers everything from hazard identification and mechanical integrity to workforce training and incident investigation, and it treats these activities as one connected system rather than a checklist of isolated tasks.

The Origin of RBPS: From CCPS to Modern Practice

CCPS published its Guidelines for Risk Based Process Safety in 2007 and the timing was not accidental. The industry had already lived through Bhopal in 1984, Piper Alpha in 1988, and a string of smaller incidents that shared a common thread: management systems that looked fine during audits but failed under real operating pressure. Regulators and engineers realized that compliance-based programs, where every element gets equal attention regardless of actual risk, were spreading effort too thin. RBPS was built to fix that gap by asking a simpler question first: what could go wrong here, and how bad would it be? Today, that same logic drives process safety practice across oil and gas, pharmaceuticals, and chemical manufacturing, and it is the reason CCPS materials remain a reference point for anyone studying process safety management at a professional level, including a professional Ofqual UK Government regulated qualification by Eduskills Training’sQualifi Level 7 International Diploma in Process Safety Management (PSM)”.

How RBPS Differs from Traditional OSHA PSM Compliance?

OSHA’s Process Safety Management standard, found in 29 CFR 1910.119, lists 14 required elements, and every covered facility must address all of them. That is a compliance floor, not a strategy. RBPS takes those same underlying concerns, hazard analysis, training, mechanical integrity, and expands them into 20 elements organized under four pillars, because a 14-point checklist cannot capture the difference between a low-pressure storage tank and a high-pressure reactor handling flammable gas. A facility following OSHA PSM alone might inspect both at the same frequency. A facility following RBPS would recognize that the reactor demands more rigorous, more frequent scrutiny, and it would allocate its safety budget accordingly. This is the core distinction: OSHA PSM tells you what to cover, but RBPS tells you how much attention each hazard actually deserves.

The Four Pillars and Twenty Elements of RBPS Explained:

RBPS organizes its 20 elements into four pillars, and each one answers a different question about how a facility manages risk. Together, these four pillars turn RBPS from a theoretical model into a working system that adjusts as a facility’s hazards and operations evolve.

Pillar 1: Commit to Process Safety:

This pillar covers safety culture, competency, workforce involvement, and stakeholder outreach, because none of the technical work matters if leadership does not back it. A facility can have the best hazard analysis in the industry, but it fails the moment operators stop reporting near misses or management stops treating safety as a real priority.

Pillar 2: Understand Hazards and Risk:

This pillar covers process knowledge management and hazard identification and risk analysis, the foundation everything else is built on. Without accurate, current process data, tools like HAZOP and LOPA produce results built on assumptions rather than reality.

Pillar 3: Manage Risk:

This is the largest pillar, with nine elements including operating procedures, asset integrity, management of change, and emergency management, since this is where day-to-day risk control actually happens. It translates hazard analysis into the operating discipline that keeps a facility running safely between audits, not just during them.

Pillar 4: Learn from Experience:

This pillar closes the loop through incident investigation, auditing, and management review because a system that never learns from its own near misses will eventually repeat them. Every unresolved corrective action from a past incident is a hazard the organization already knew about and chose not to fix.

Applying HAZOP Methods to Process Safety Incidents:

A HAZOP study, short for Hazard and Operability Study, is one of the most widely used tools inside Risk Based Process Safety, because it forces a team to walk through a process systematically instead of relying on assumptions about what could go wrong.

Most process safety incidents do not happen because nobody thought about the hazard. They happen because someone assumed a scenario was too unlikely to matter, or because the review missed one specific deviation buried in a complex system.

HAZOP closes that gap by structuring the conversation, so a multidisciplinary team examines every section of a process and asks what happens if a parameter deviates from its design intent. It is slow, it is detailed, and that is exactly the point.

What a HAZOP Study Involves and Why It Matters?

A HAZOP session brings together operators, engineers, and a trained facilitator to examine a process piping and instrumentation diagram section by section, or node by node. The team does not just look for obvious failures. They apply structured guide words to each process parameter, flow, pressure, temperature, and level, to surface deviations that would otherwise stay hidden until something actually breaks. This matters because a process hazard analysis built on unstructured brainstorming tends to catch the hazards everyone already knows about and miss the ones nobody has considered yet. HAZOP is deliberately repetitive and exhaustive, because the value comes from covering every node the same rigorous way, not from moving quickly through the ones that seem obviously safe.

Nodes, Guide Words and Deviations Explained Simply:

A node is simply a defined section of the process, often a single pipeline segment or a vessel, small enough that the team can analyze it in detail without losing focus. Guide words are the standardized prompts applied to each parameter at that node: more, less, none, reverse, and other. Say a node covers a feed line into a reactor and the parameter under review is flow. Applying “more” flow might reveal a runaway reaction risk. Applying “none” might reveal a dry-run condition that damages equipment. Each guide word, paired with each parameter, generates a deviation, and the team then works through causes, consequences, and existing safeguards for that specific deviation. This is what separates HAZOP from a general safety walkthrough, since the guide words remove guesswork from where the team looks next.

Common Mistakes Teams Make During HAZOP Sessions:

Most HAZOP failures trace back to a handful of recurring habits, not to the methodology itself. Here’s where teams typically go wrong:

  • Rushing the node breakdown. Teams under time pressure tend to group too much equipment into a single node just to move faster through the study. That single decision quietly erodes the entire analysis, since deviations that would have surfaced at a finer level of detail simply never get discussed.
  • Bringing the wrong team into the room. A HAZOP without an experienced operator misses the practical failure modes that only show up during actual operation, not on the design drawing.
  • Accepting “adequate safeguard” answers without verifying them. Teams frequently assume a listed safety instrumented function or alarm will perform as intended, without confirming it against actual mechanical integrity and testing records.
  • Letting the session drift into real-time problem solving. Facilitators sometimes allow the team to start solving issues on the spot instead of simply documenting them for follow-up, which stalls the review and burns hours that should have covered three more nodes.

How to Quantify Risk in Process Safety Industries?

Identifying a hazard is only half the job because a facility still has to decide how serious it actually is before deciding what to do about it. This is where quantitative risk analysis enters Risk Based Process Safety, since it turns a vague sense of “this seems dangerous” into numbers that engineers, managers and regulators can actually act on.

A hazard that could kill one person once every ten thousand years demands a different response than one that could kill ten people once every hundred years, even though both might get flagged during a HAZOP. Quantification is what lets an organization tell those two scenarios apart and spend its safety budget where it actually reduces the most risk, rather than where it feels most urgent in the moment.

Qualitative Versus Quantitative Risk Analysis Compared:

Qualitative analysis relies on descriptive categories, low, medium, high, to rank hazards quickly, and it works well for early-stage screening because it does not require detailed data or complex modeling.

Quantitative analysis instead assigns numerical values to likelihood and consequence, producing outputs like frequency per year or expected fatalities, and this level of detail matters when a decision involves significant capital or when regulators require a defensible number rather than a subjective label.

Neither approach replaces the other. A facility typically starts with qualitative screening to identify which scenarios deserve deeper attention, then applies quantitative methods only to the higher-risk cases, because running full quantitative analysis on every single hazard would burn resources the program does not have. The skill lies in knowing when to stop at qualitative and when the stakes justify going further.

Key Risk Metrics: Likelihood, Consequence and Matrices:

Likelihood measures how often a scenario is expected to occur, usually expressed as a frequency, while consequence measures the severity of the outcome if it does, whether that is injury, environmental damage, or financial loss.

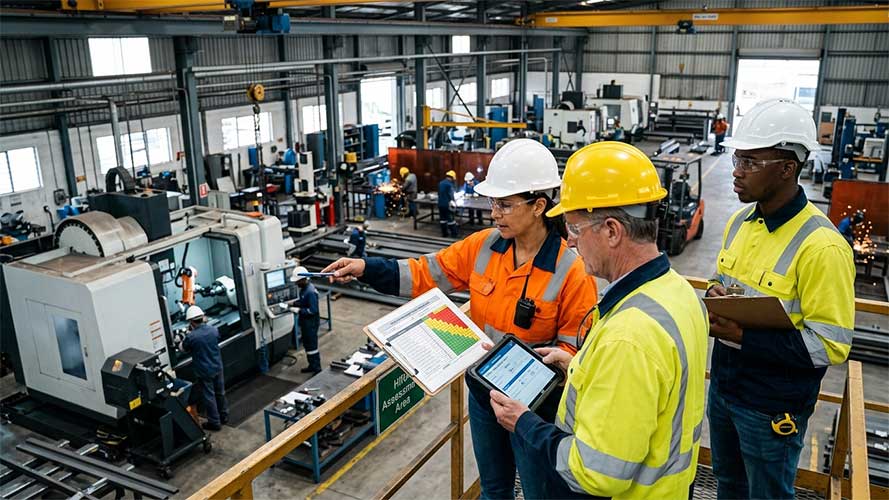
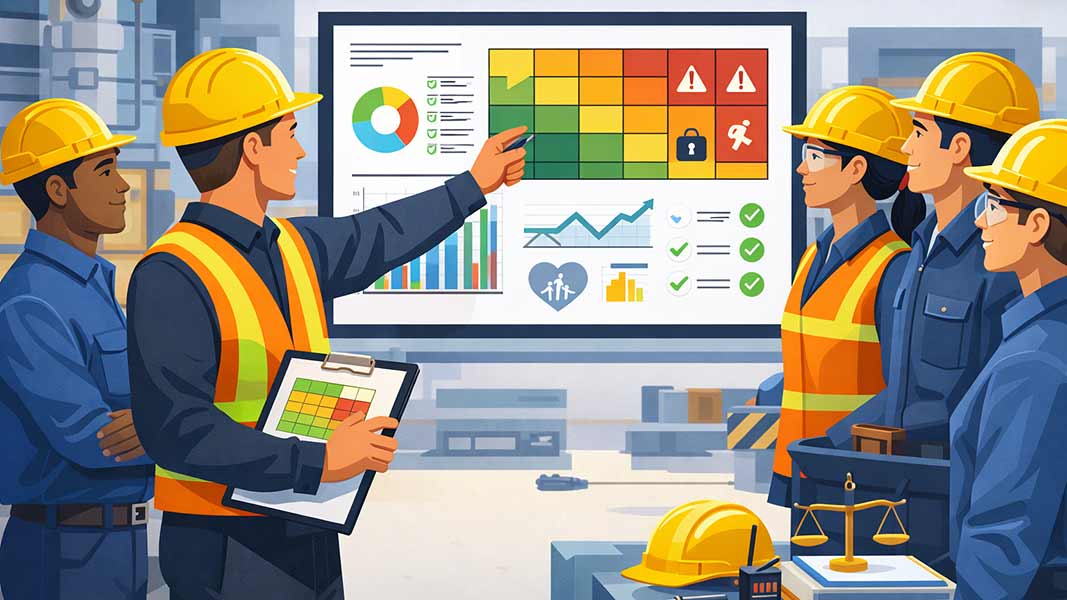
A risk matrix plots these two variables against each other, giving teams a visual way to see which combinations fall into acceptable, tolerable, or unacceptable zones.

This tool gets criticized sometimes for oversimplifying complex scenarios, and that criticism has some merit, but it remains valuable precisely because it forces a structured conversation between people with different technical backgrounds. An operator, an engineer, and a safety manager can all look at the same matrix and agree on where a hazard sits, even if they arrived there through different reasoning. That shared reference point is what keeps risk ranking consistent across an entire facility rather than depending on whoever happens to be in the room.

A Practical Introduction to Quantitative Risk Assessment:

Quantitative Risk Assessment, or QRA, takes the matrix approach a step further by modeling actual failure frequencies, dispersion patterns, and potential harm using engineering data and historical incident statistics.

A QRA for a flammable gas release, for example, would calculate the probability of ignition, model how far a vapor cloud could travel under different weather conditions, and estimate the resulting harm to people and structures at various distances. This is not a quick exercise. It demands specialized software, reliable input data, and analysts trained to interpret the results correctly, since a poorly built QRA can produce numbers that look precise but mean very little.

Facilities usually reserve full QRA for their highest-consequence scenarios, tank farms, reactors handling toxic materials, offshore platforms, because the cost and effort only pay off when the potential loss is severe enough to warrant that level of scrutiny.

Evaluating Mechanical Integrity, LOPA and P&IDs:

A hazard analysis only protects a facility if the equipment behind it actually works the way the design says it should, and that is where mechanical integrity enters Risk Based Process Safety. A relief valve that was sized correctly on paper does not help anyone if corrosion has quietly reduced its capacity over five years of service. This section covers three tools that work together: asset integrity programs that keep equipment reliable, Layer of Protection Analysis that confirms your safeguards are actually sufficient, and P&IDs that give engineers the map they need to spot risk before it becomes an incident.

Why Mechanical and Asset Integrity Cannot Be Ignored:

Most catastrophic process safety incidents trace back to equipment that failed to perform as designed, not to some unforeseeable event nobody could have predicted. A pipe wall thins from corrosion, a pressure relief device sticks from lack of testing, a gasket fails because it was installed with the wrong material. None of these are exotic failure modes. They are the predictable result of deferred inspection and maintenance, which is exactly why asset integrity sits as its own dedicated element inside RBPS rather than getting folded into general maintenance.

A strong mechanical integrity program tracks inspection intervals, documents actual equipment condition against design specifications, and flags degradation before it crosses into failure territory. Skipping this work does not save money. It just moves the cost from a scheduled inspection to an unscheduled shutdown, or worse.

Layer of Protection Analysis: Adding a Safety Layer

LOPA takes the hazards identified during HAZOP and asks a sharper question: given everything that could go wrong here, do we actually have enough independent safeguards to keep the risk at an acceptable level? Each safeguard, a relief valve, an interlock, an alarm with operator response, only counts as an independent protection layer if it can function on its own without depending on another safeguard already counted in the same scenario.

This matters because teams sometimes double-count protection without realizing it, listing both an alarm and the operator response to that alarm as two separate layers when they are really one dependent chain.

LOPA forces that distinction into the open through a semi-quantitative method that sits between a full QRA and a basic risk matrix, giving engineers enough rigor to size safety instrumented functions correctly without the time and cost of a complete quantitative study.

Reading P&IDs to Spot Hidden Process Risks Early:

A Piping and Instrumentation Diagram, or P&ID, is the technical drawing that shows every pipe, valve, vessel, and instrument in a process, along with how they connect and where control logic sits. Engineers use it constantly during HAZOP sessions because it is the closest thing to a complete picture of how the process actually behaves under normal and abnormal conditions. Someone who can read a P&ID fluently starts noticing things a casual glance would miss: a bypass line that defeats a safety interlock, a single point of failure where two redundant systems actually share one common valve, or instrumentation that was added after the original design without updating the surrounding safeguards. This is why P&ID literacy is not optional for anyone working in process hazard analysis. The drawing tells the truth about the process even when the operating procedures have not been updated to match.

Checking Operational Readiness of Safety Systems:

Analysis and design work mean little if a facility cannot confirm the system is actually ready to operate safely, and that confirmation is where operational readiness becomes its own discipline inside Risk Based Process Safety. This section covers four checkpoints that catch problems before startup rather than after: rating how reliable your protective systems need to be, sizing your last line of defense for worst case scenarios, verifying everything before you go live, and controlling one of the most common ignition sources on any site.

Safety Integrity Levels and What They Really Mean:

A Safety Integrity Level, or SIL, is a measure of how reliably a safety instrumented function needs to perform its job, expressed as a target probability of failure on demand.

SIL ratings run from 1 to 4, and a higher number means the consequences of failure are severe enough that the system must fail far less often, sometimes by an order of magnitude between each level. Assigning the wrong SIL in either direction creates a real problem. Under-specify it, and you end up with a safety instrumented function that cannot reliably stop the hazard it was built for. Over-specify it, and you spend money on redundancy and testing frequency the actual risk never justified. This is why SIL determination connects directly back to LOPA, since the risk gap identified during LOPA is what tells engineers how much reliability the safety function actually needs to close it.

Designing Emergency Relief Systems for Worst Case Events:

Emergency relief systems exist for the scenario nobody wants but every facility has to plan for anyway, the moment when pressure inside a vessel exceeds what the equipment can safely contain.

A properly sized relief valve or rupture disk gives that excess pressure somewhere to go before the vessel itself fails, and getting the sizing wrong in either direction creates a problem. Undersized relief cannot vent fast enough during a runaway reaction or fire exposure scenario. Oversized relief can cause its own operational headaches, including nuisance releases that erode trust in the system.

Engineers calculate relief requirements against specific worst case scenarios, blocked outlet, external fire, control valve failure, because a relief system sized for one scenario may not protect against another entirely different failure mode on the same vessel. The relief system is the backstop after every other safeguard has already failed, which is exactly why its design tolerance for error is so low.

Pre-Startup Safety Review Before Going Live Again:

A Pre-Startup Safety Review, or PSSR, is the final checkpoint before a process goes live, whether that is a brand new unit or an existing one coming back online after modification or turnaround. The review confirms that construction matches the design, that operating procedures reflect the current configuration, that safety systems are functional and tested, and that operators have actually been trained on what they are about to run.

Skipping or rushing a PSSR is how facilities end up starting equipment that looks ready on paper but was never actually verified against reality. This checkpoint matters most after a management of change, because that is exactly when small, well-intentioned modifications quietly introduce a hazard nobody accounted for in the original design, and a thorough PSSR is what catches it before startup rather than during it.

Hot Work Permits and Controlling Ignition Risk:

Hot work, welding, cutting, grinding, any activity that produces sparks or open flame, is one of the most common ignition sources in a process facility, and a hot work permit system exists to make sure that work never happens near a flammable atmosphere without deliberate controls in place. The permit process typically requires gas testing before work begins, continuous monitoring during the job, fire watch personnel on standby, and a clear stop-work trigger if conditions change. This sounds like basic paperwork until you look at how many major fires trace back to hot work performed without proper isolation or atmospheric testing, often because someone assumed the area was clear based on a check done hours earlier rather than one done right before the spark started flying. A hot work permit is not bureaucracy for its own sake. It is the control that stands between routine maintenance and an entirely preventable fire.

Why Risk Based Process Safety Matters for Industry?

RBPS is not an academic exercise for people who like frameworks. It exists because the alternative, treating every hazard with the same level of attention, gets people killed and shuts plants down for months. This section looks at three reasons Risk Based Process Safety earns its place on the priority list, not as a compliance checkbox, but as a system that actually changes outcomes.

Preventing Catastrophic Loss Before It Ever Happens:

Every major process safety disaster, Bhopal, Piper Alpha, Texas City, shares a pattern once investigators pull it apart: warning signs existed, but nobody connected them into a picture serious enough to act on before the event. RBPS exists precisely to break that pattern, because it forces an organization to rank hazards by actual severity and then verify, through HAZOP, LOPA, and mechanical integrity checks, that the safeguards protecting against the worst outcomes are real and tested, not just documented. This does not mean incidents become impossible. It means the highest-consequence scenarios get the scrutiny they deserve before they turn into a CSB investigation report, rather than after.

Smarter Resource Allocation and Measurable Cost Savings:

A facility with a fixed safety budget and dozens of hazards to manage cannot treat every single one identically, since spreading resources evenly across low-risk and high-risk scenarios wastes money on the former and underfunds the latter. RBPS solves this by directing inspection frequency, staffing, and capital investment toward the hazards that genuinely carry the most risk. That targeting pays off financially too, because a single major incident routinely costs more than an entire year of a robust safety program, once you count lost production, legal exposure, regulatory fines, and reputational damage.

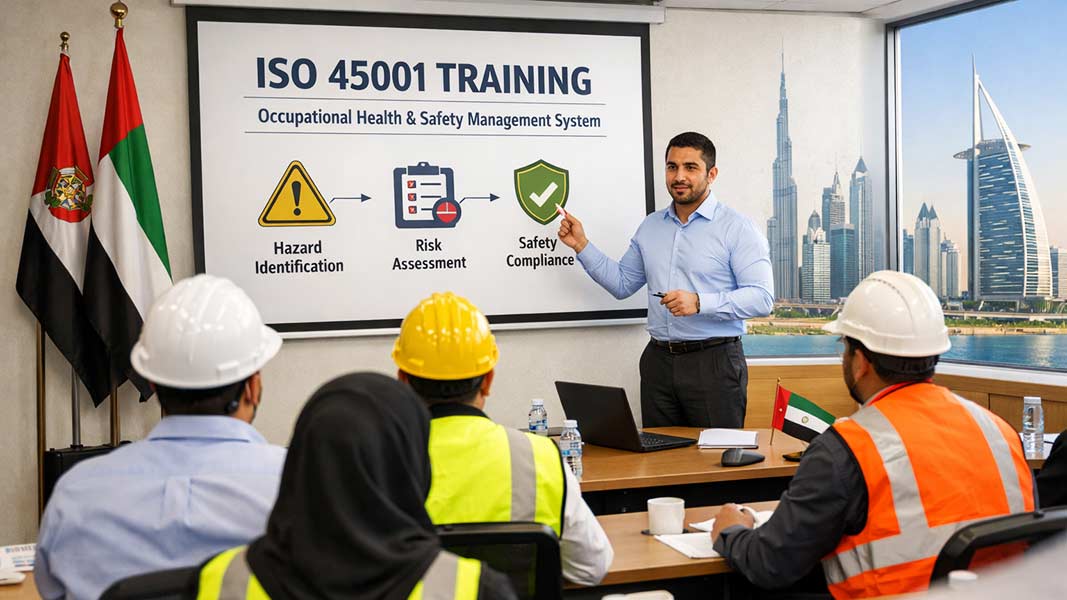
Organizations that train their teams properly, through structured programs like those offered by Eduskills Training, tend to catch this efficiency early, because a workforce that understands risk-based prioritization stops wasting effort on hazards that were never the real threat.

Building Regulatory Trust with Communities and Regulators:

Regulators and surrounding communities pay closer attention to facilities with a history of near misses or unclear safety documentation, and that attention translates into more frequent inspections, slower permit approvals, and less benefit of the doubt when something does go wrong. RBPS builds trust in the opposite direction, because a facility that can show its hazard analysis, its safeguard verification, and its incident learning process demonstrates real command of its own risk, not just a compliance file assembled to survive an audit. Stakeholder outreach, one of the twenty RBPS elements, specifically addresses this by keeping communication open with emergency responders and local communities before an incident ever happens, so trust already exists if one does.

Common Challenges When Implementing RBPS Programs:

RBPS works, but it does not implement itself smoothly just because the framework is sound. Most organizations run into the same three obstacles, and understanding them ahead of time is what separates a program that sticks from one that quietly fades after the first audit cycle.

Managing the Complexity of Twenty RBPS Elements:

Twenty elements across four pillars sounds manageable until a team actually starts building out the sub-processes underneath each one, since every element carries its own documentation, training requirements, and review cycles. Smaller organizations especially struggle here, because they often lack the dedicated process safety staff that larger facilities can assign to a single element full time.

The mistake most teams make is trying to implement all twenty elements at once, with equal depth, which spreads effort so thin that nothing gets done well. A better approach prioritizes the elements tied to your highest-risk operations first, then builds outward, so the program gains real traction instead of stalling under its own scope.

Integrating RBPS into Existing Management Systems:

Most facilities already run a quality management system, an environmental management system, or both, and RBPS does not exist in isolation from them. The challenge is making sure these systems talk to each other instead of duplicating work, because a management of change process that exists separately in the safety system and the quality system creates confusion about which one actually governs a given decision. Successful integration usually means mapping RBPS elements against existing procedures first, identifying where overlap already exists, and consolidating rather than layering a brand new parallel system on top of what already works. Skipping this step is how organizations end up with three different versions of the same procedure, none of which anyone fully trusts.

Keeping the System Alive Beyond the First Year:

RBPS programs often launch with genuine energy, a kickoff meeting, new procedures, visible leadership support, and then quietly lose momentum once the initial push fades and daily operations reclaim everyone’s attention. This is the most common failure point, because a program that only gets reviewed during scheduled audits is not really being managed. It is being maintained on paper. Sustaining RBPS long term requires it to become part of how decisions actually get made, management of change reviews that genuinely happen before modifications, incident investigations that produce real corrective actions instead of a closed ticket, and leadership that asks about safety performance the same way it asks about production numbers. The programs that survive past year one are the ones where risk-based thinking becomes routine, not the ones with the most polished launch.

Frequent Asked Questions (FAQs):

What is the difference between RBPS and Process Safety Management (PSM)?

PSM, under OSHA 29 CFR 1910.119, sets 14 mandatory elements that apply equally to every covered facility. RBPS expands this into 20 elements across four pillars and applies varying levels of rigor based on actual hazard severity, so higher-risk operations get more scrutiny than lower-risk ones.

How many elements does RBPS have, and how are they organized?

RBPS has 20 elements organized under four pillars: Commit to Process Safety, Understand Hazards and Risk, Manage Risk, and Learn from Experience. Manage Risk carries the most elements, nine in total, because it covers day-to-day risk control activities.

What is the difference between HAZOP and LOPA?

HAZOP identifies hazards and deviations qualitatively by working through nodes and guide words. LOPA takes those identified scenarios and applies semi-quantitative analysis to confirm whether existing independent protection layers reduce risk to an acceptable level.

How does LOPA determine the required Safety Integrity Level (SIL) for a safety instrumented function?

LOPA calculates the gap between the unmitigated risk of a scenario and the tolerable risk target. The safety instrumented function must close that specific gap, and the required probability of failure on demand for that gap determines the SIL rating, from SIL 1 through SIL 4.

What is the difference between qualitative and quantitative risk assessment?

Qualitative assessment uses descriptive categories like low, medium, and high for fast screening. Quantitative assessment, including QRA, assigns numerical values to frequency and consequence, producing defensible figures used for high-consequence scenarios and regulatory submissions.

When should a facility run a full Quantitative Risk Assessment instead of relying on a risk matrix?

Full QRA is reserved for the highest-consequence scenarios, such as tank farms, reactors handling toxic materials, or offshore platforms, where the cost and complexity of detailed modeling is justified by the severity of potential loss.

What is the purpose of a Pre-Startup Safety Review (PSSR)?

A PSSR confirms that construction matches design, procedures reflect the current configuration, safety systems are tested and functional, and personnel are trained, before a unit starts up or restarts after modification or turnaround.

Why is PSSR especially important after a Management of Change (MOC)?

Modifications made through MOC can introduce hazards that were not present in the original design. PSSR is the checkpoint that catches those gaps before startup, rather than after an incident reveals them.

What information does a P&ID provide that a process flow diagram does not?

A P&ID shows every pipe, valve, vessel, and instrument along with control logic and interconnections, giving engineers the detail needed to identify bypass lines, shared failure points, and safeguard gaps that a simplified flow diagram would not capture.

Does RBPS replace the need for OSHA PSM compliance?

No. RBPS builds on top of OSHA PSM rather than replacing it. A facility still must meet all 14 PSM elements as a regulatory floor, while RBPS adds the risk-based prioritization that determines how much rigor each hazard actually warrants.

Inquiry Form